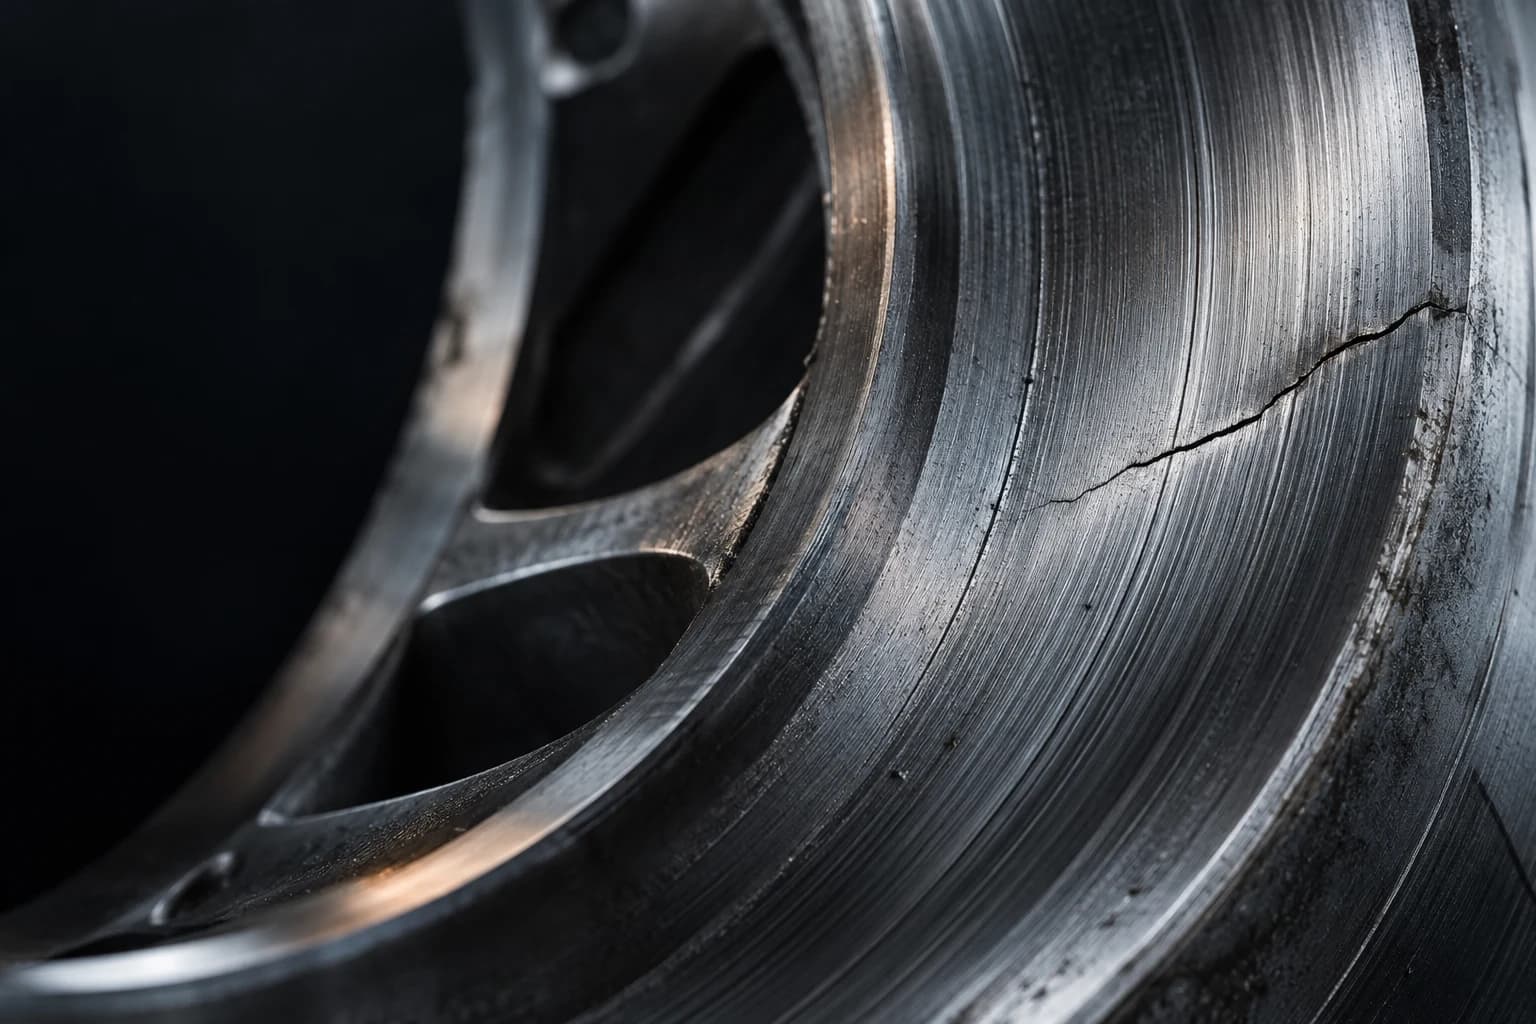
Give maintenance time to respond
Flag assets that may need attention using sensor history and maintenance records, with the signals behind the warning
Find the pattern behind a bad batch
Compare defects with production and inspection conditions to investigate possible causes
Build a plan the line can meet
Use throughput forecasts to examine scheduling choices and likely production constraints
Turn inspection findings into priorities
Classify defect types across product lines so quality teams can review recurring problems
Define what a better outcome looks like
Which early signals are worth acting on before the next stoppage?
- Start with a fair comparison
- Compare warnings with the current maintenance approach for a defined asset group, using only signals that preceded each event
- Keep the decision in view
- Review the source readings and inspection history, then record the maintenance or quality action chosen by the team
- Measure the result
- Track missed failures, false alarms and warning lead time. Assess downtime, scrap and rework separately to understand whether the actions helped